Debug a Website in iOS Safari on Windows 10
Have you ever needed to debug a website (especially JavaScript or CSS) in Safari on an iOS device but didn't have a Mac handy? I ran into this problem, and after hours of trying other ways to debug, I finally discovered a pretty easy way to load up a debug interface on my Windows 10 PC that displayed debug info about a website in Safari on an iPad Mini.
[update 10/20/2019 - I've heard reports that this solution only works in iOS 12 and below, not iOS 13 and up. I can neither confirm or deny.]
[update 5/6/2018 - I previously included a solution that used WebIDE in the Mozilla Firefox browser, along with the Valence plugin. At some point, possibly beginning with iOS 9, that solution stopped working. I recently had a chance to try some other solutions and found an even easier solution that works with Google Chrome DevTools!]
Thankfully, this solution uses the Google Chrome browser on your PC and the built-in Chrome DevTools that you should already be used to, but the content is coming from the website in Safari on the iOS device.
According to what I've read online, it appears this solution only works with Windows 8 and up, so this may not work on Windows 7.
Let's get to it!
Solution
I recorded a tutorial video of this solution, step-by-step, to go along with this post:
- Install iTunes on your Windows 10 PC.
I installed the 64-bit version. We mostly need the Apple Mobile Device Support and Apple Application Support apps that come with iTunes. I actually uninstalled iTunes after ensuring those other apps were installed, but it looks like you need iTunes installed to connect devices to your PC, so you might want to keep it installed. Here's what you need to see: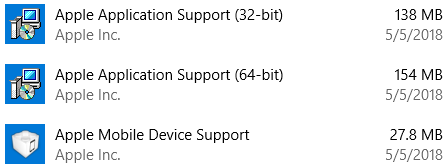
- Install Node.js.
When you install, make sure the package manager is selected (it is by default), as we'll be needing that to install the webkit adapter. - Run Windows PowerShell as administrator.
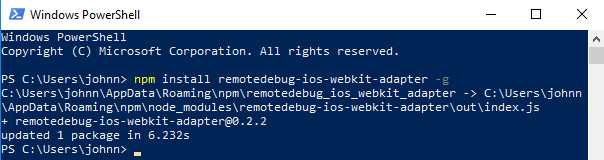
Press theWindows Key + Sto search, then search for "PowerShell". Right-click on Windows PowerShell and click Run as administrator. - Install the remotedebug-ios-webkit-adapter.
Use the following PowerShell command:npm install remotedebug-ios-webkit-adapter -g
When that is complete, you will see an "updated 1 package in Xs" message:
- Connect your iOS device to your Windows 10 PC via USB.
If you haven't connected the devices previously, you will need to click to trust the connection on both devices. - Start the webkit adapter plugin listening on port 9000.
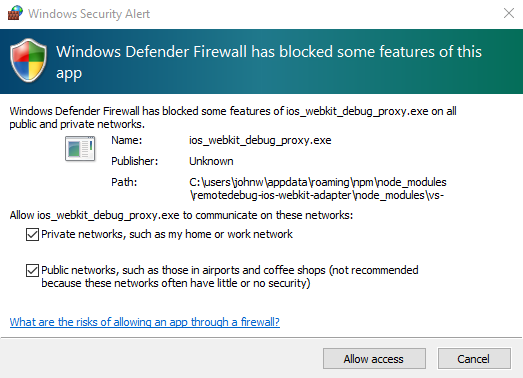
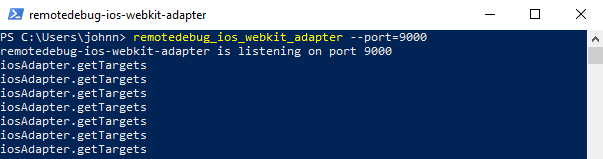
Paste the following command into PowerShell:remotedebug_ios_webkit_adapter --port=9000
You will need to allow the plugin through your firewall as well. I use the default Windows Firewall, so I got a dialog like this:
Once it begins running, you will see the message remotedebug-ios-webkit-adapter is listening on port 9000 followed by iosAdapter.getTargets:
- Open up the Chrome browser and browse to chrome://inspect/#devices.
Since we set the adapter to listen on port 9000, we need to add a network target. Click "Configure" next to Discover network targets: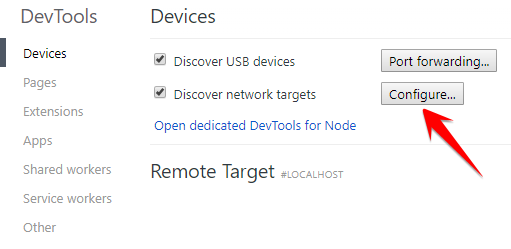
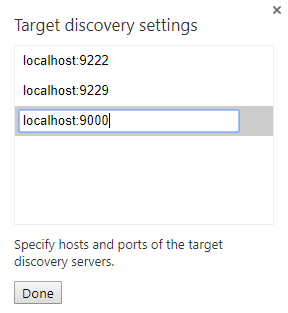
Then, make sure the target "localhost:9000" is in the list:
- Enable web inspector on your iOS device.
On your iOS device, go toSettings > Safari > Advancedand enable Web Inspector. - Open Safari on your iOS device and browse to a website.
You should almost immediately see the website appear in Chrome under the Remote Target section:
- Click inspect under the target.
Success! You can now debug the site in Safari on your iOS device, but from Chrome DevTools on your Windows machine.
It should take you around 5 minutes to set this up, and you can be debugging a website in no time!
Using iOS 11?
You may need some extra steps to get this working on an iOS 11 device. Evidently, the version of the remotedebug-ios-webkit-adapter downloaded via npm is broken for iOS 11. The user bdice wrote a post on the remotedebug-ios-webkit-adapter Github Issues page describing how he was able to get this working on Windows 10 with an iOS 11 device. I tested it out, and here's the lowdown:
- Download the most recent ZIP release file of remotedebug-ios-webkit-adapter.
I downloaded version 1.8. - Create a new folder named "ios-webkit-debug-proxy-1.8-win64-bin" in the following path (assumes you installed Node.js in the default directory):
%AppData%\npm\node_modules\remotedebug-ios-webkit-adapter\node_modules\vs-libimobile\ - Extract the files from the ZIP to that folder.
If you used my assumptions and suggestions above, the path should be:%AppData%\npm\node_modules\remotedebug-ios-webkit-adapter\node_modules\vs-libimobile\ios-webkit-debug-proxy-1.8-win64-bin - Edit the iosAdapter.js file.
Open the file from the following location:%AppData%\npm\node_modules\remotedebug-ios-webkit-adapter\out\adapters\iosAdapter.jsOn line 132, change the
proxyvariable to the following value:const proxy = path.resolve(__dirname, '../../node_modules/vs-libimobile/ios-webkit-debug-proxy-1.8-win64-bin/ios_webkit_debug_proxy.exe');
After you have jumped through all these hoops, I would restart Windows PowerShell (as Administrator!), restart Chrome, and unplug then plug back in your iOS device, just to be safe. After doing so, go back to step 6 above, and when you get to step 9, you should now see your device under the list of Remote Targets!
I tested this out, and it definitely worked!
Your Turn!
Have you tried debugging a website in Safari on iOS with a Windows machine before? How did it work out for you, and what tool(s) did you use? Or did you have a problem with this solution you'd like to discuss? I'd love to hear from you, so let's discuss in the comments below!